Storm Overflows
Experimental map highlighting pollution discharge in our rivers and seas… hoping visualising might lead to change.
Data shows how often monitored storm overflows discharged during 2020 for water companies operating in England and Wales. A Blender metaball is created at each discharge point and the size represents the number of times storm discharge occured at that point. The whole of England is covered, but only the South West is rendered for the animation.
Dataset © Environment Agency copyright and/or database right 2020. All rights reserved. Dŵr Cymru/Welsh Water. The Rivers Trust.
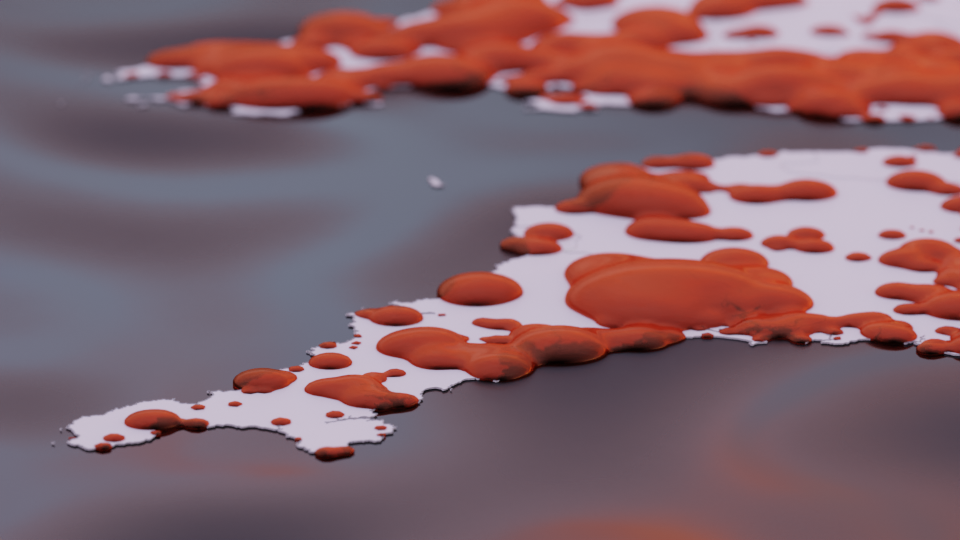
Using MetaBalls helps create a fluid effect without the overhead of a full simulation
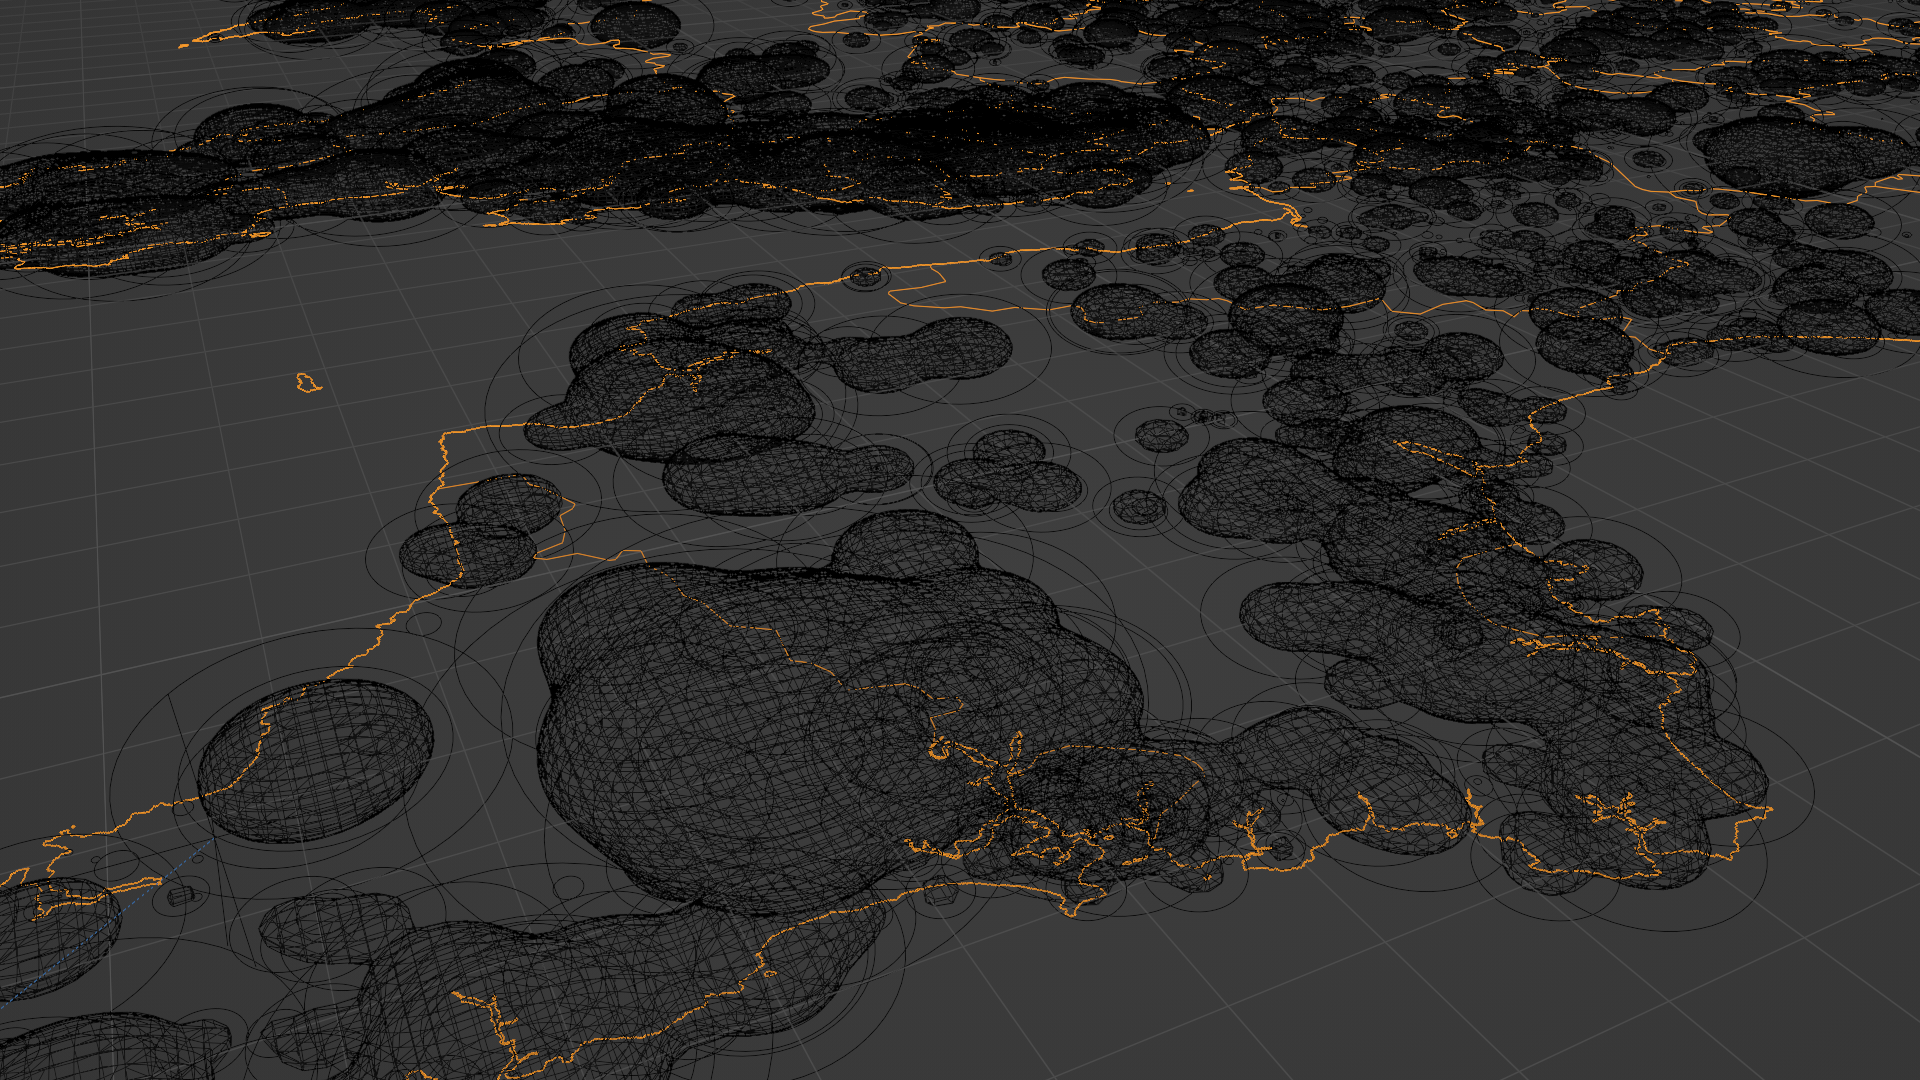
The code is create the MetaBalls is straightforward. With a large number of MetaBalls, Blender needs calulation time at the end… Be patient…
def createMetaBallElements(data):
	c = 0
	scaleFactor = 50
	shrink = 1
	# add metaball object
	mball = bpy.data.metaballs.new("MetaBall")
	obj = bpy.data.objects.new("MetaBallObject", mball)
	bpy.context.collection.objects.link(obj)
	mball.resolution = scaleFactor * 20 / shrink  # View resolution
	mball.render_resolution = scaleFactor * 20 /  shrink
	for d in data:
		print(c)
		if (d.count > 0):
			x = d.x
			y = d.y
			z = 0
			radius = int(scaleFactor * d.count)
			print('Adding %d at (%f, %f, %f) with count: %f and radius %f' %(c, x, y, z, d.count, radius))
			element = mball.elements.new()
			element.co = (x,y,z)
			element.radius = radius / shrink
		c = c + 1