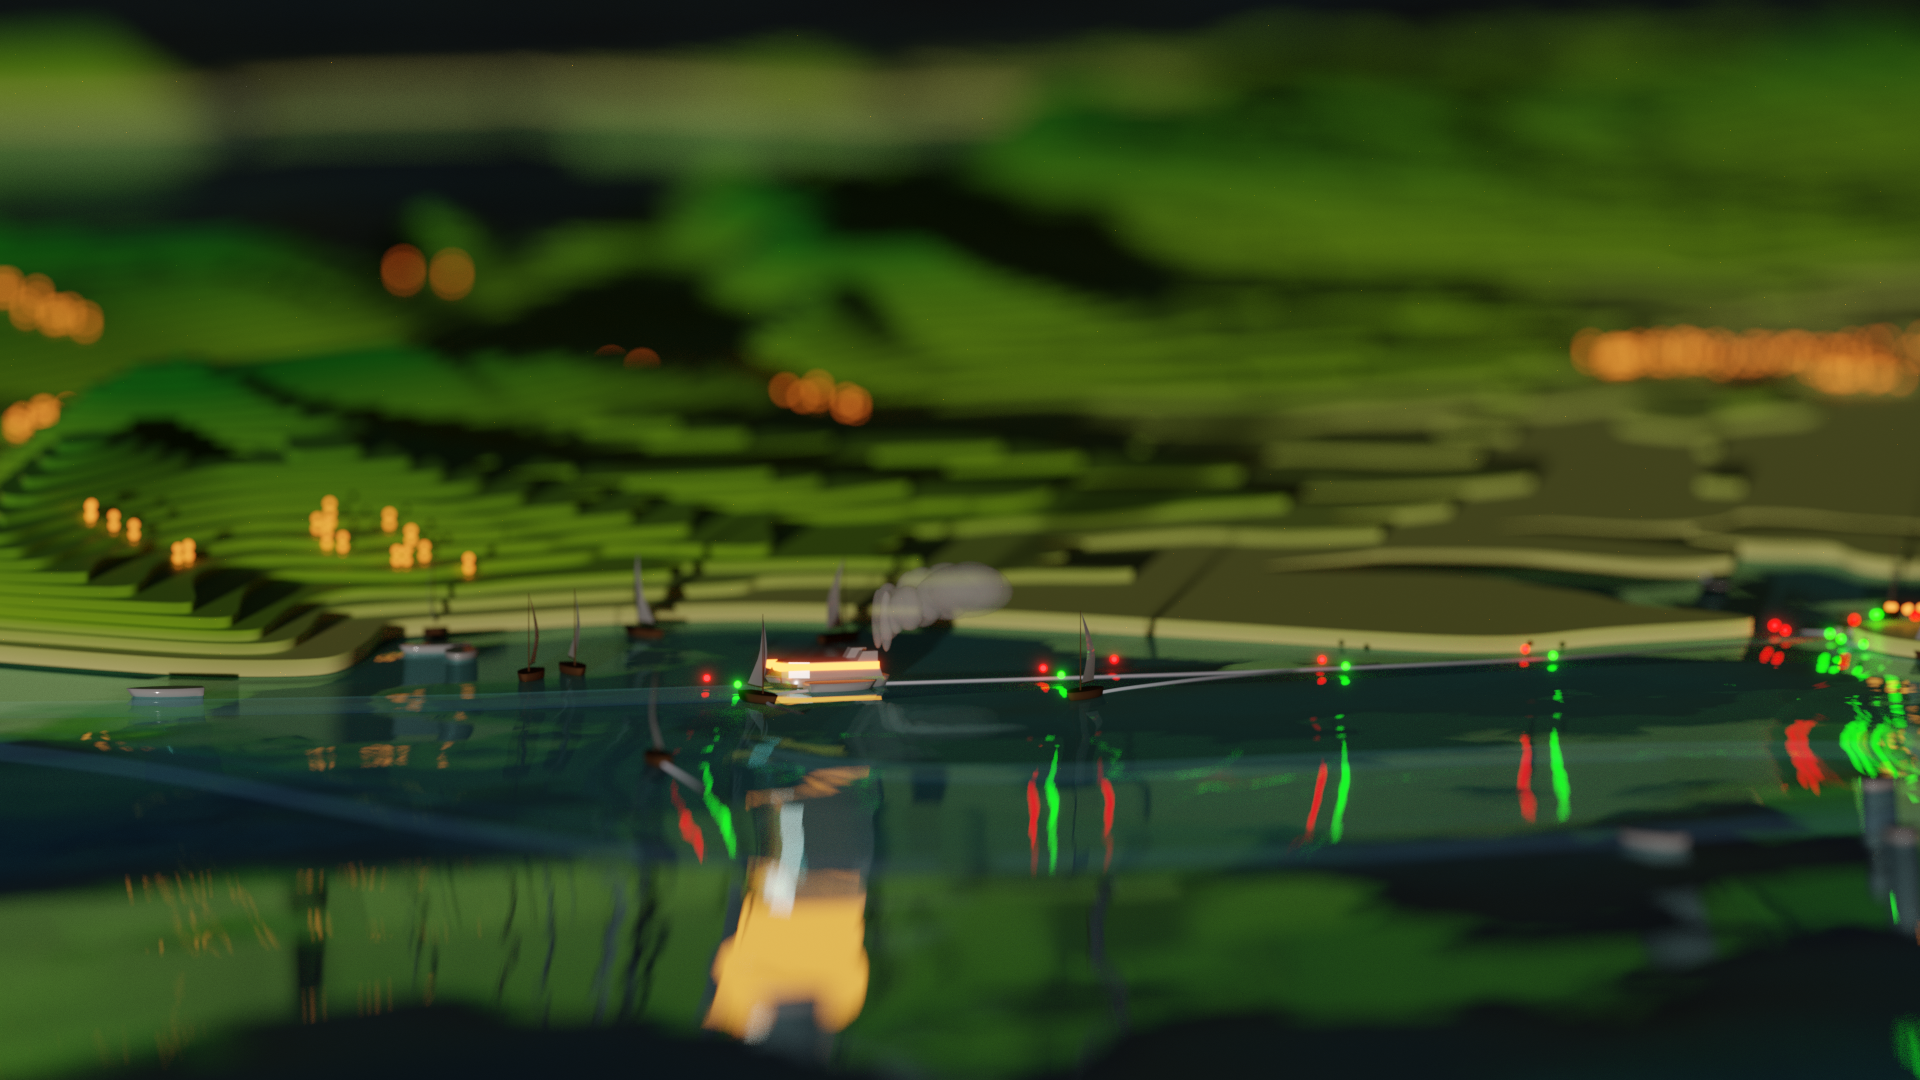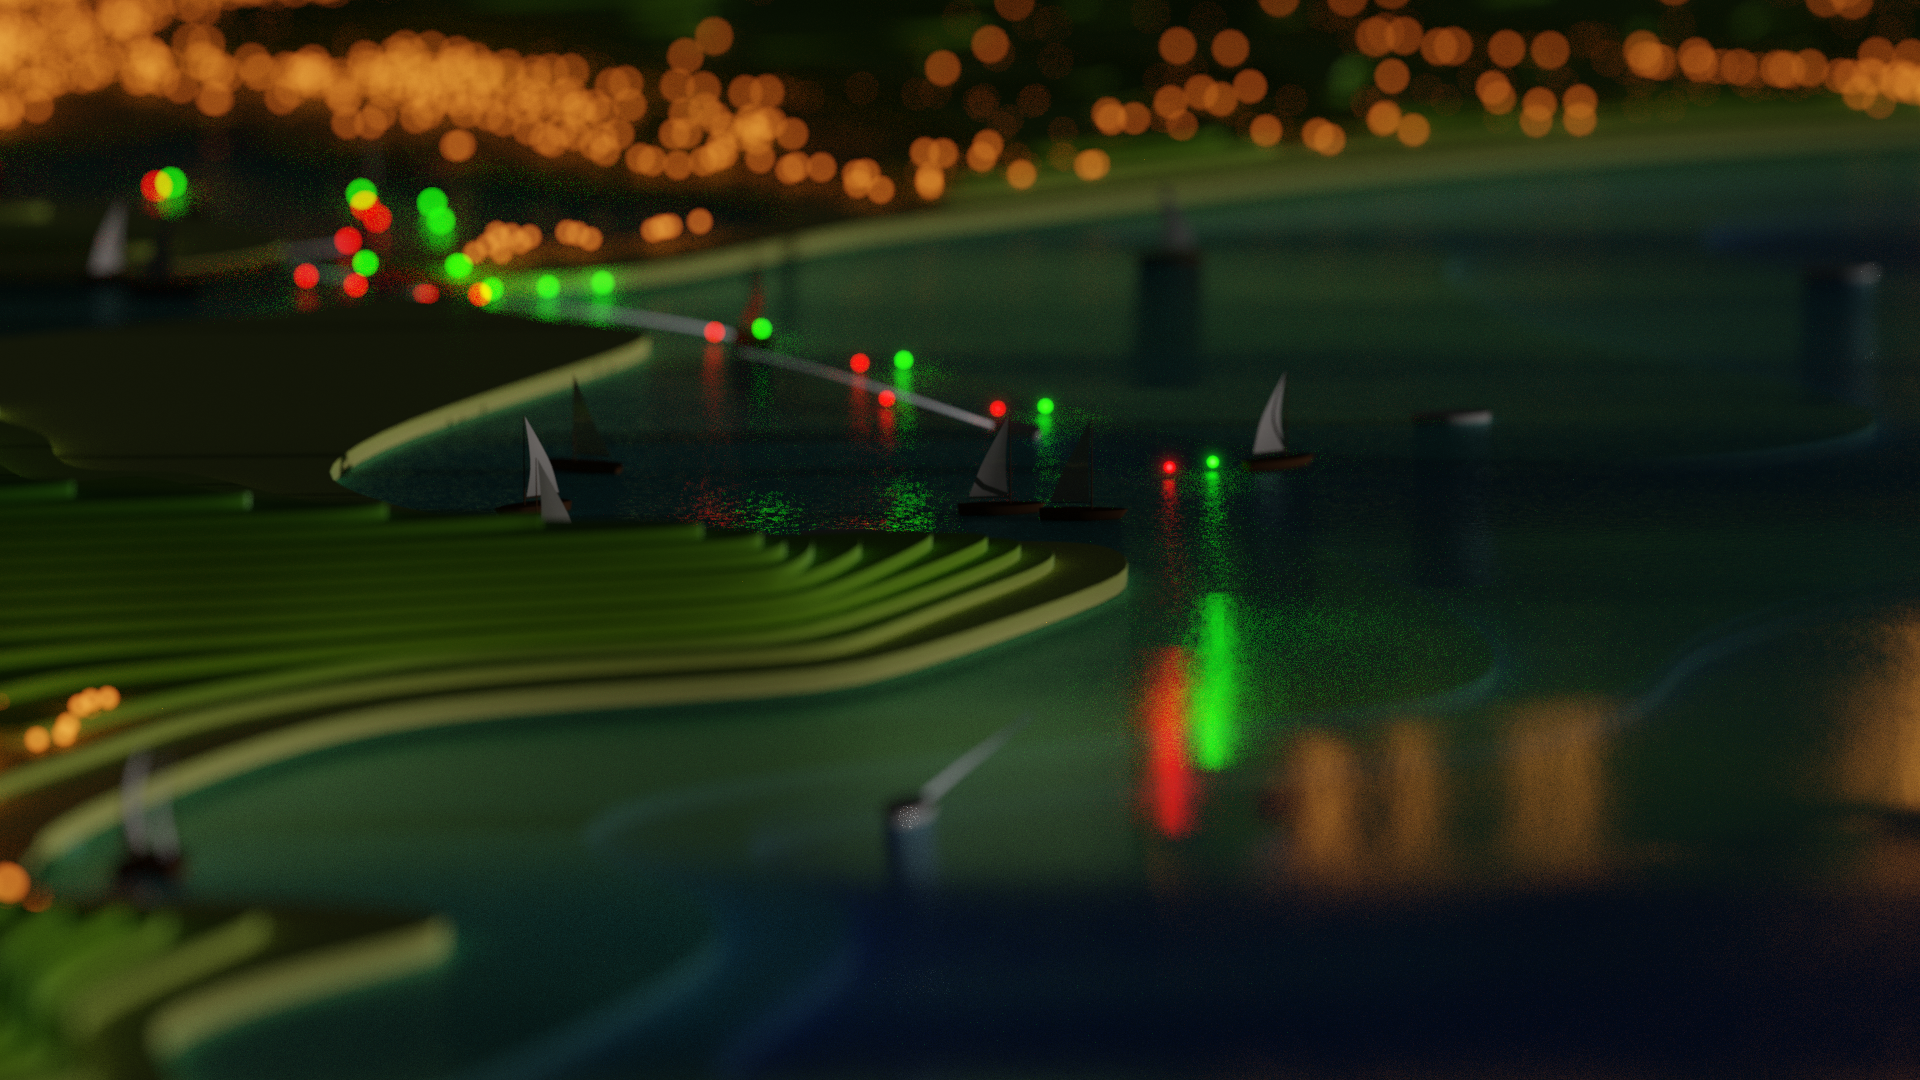
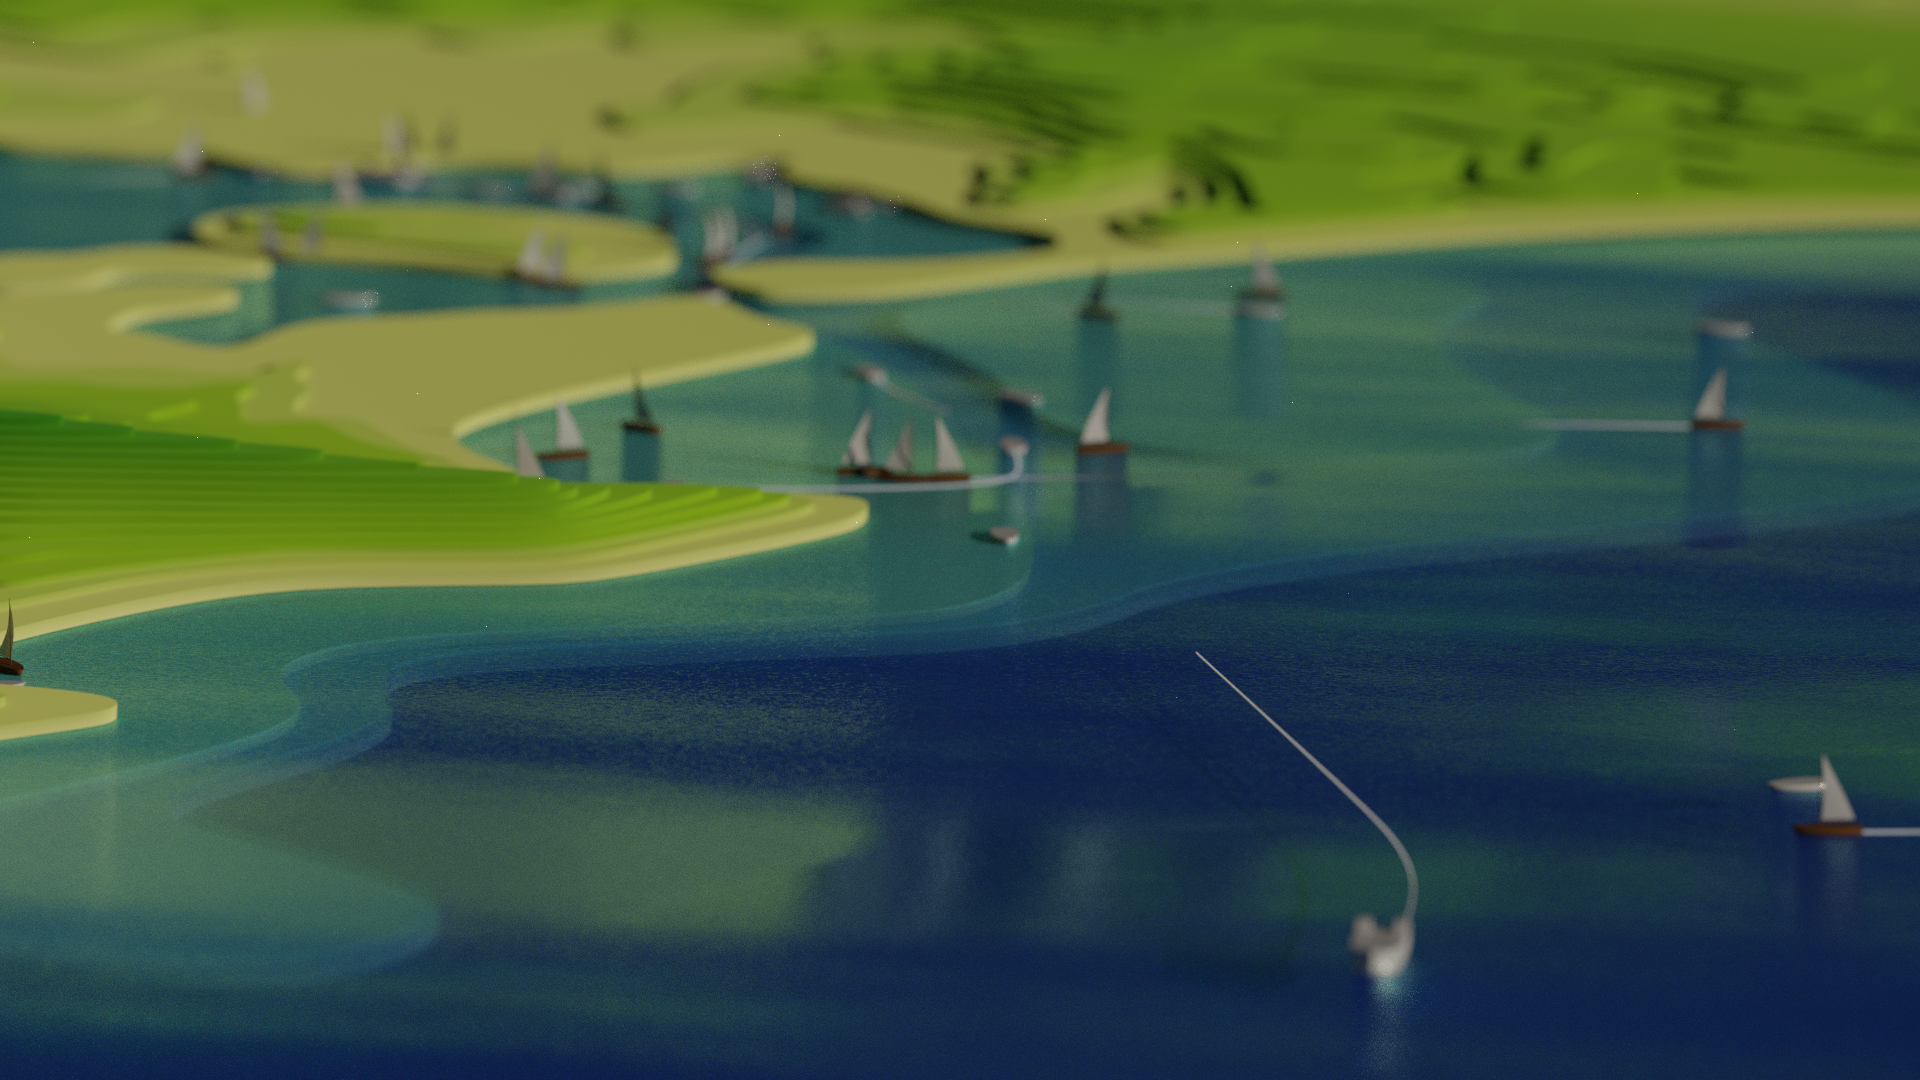
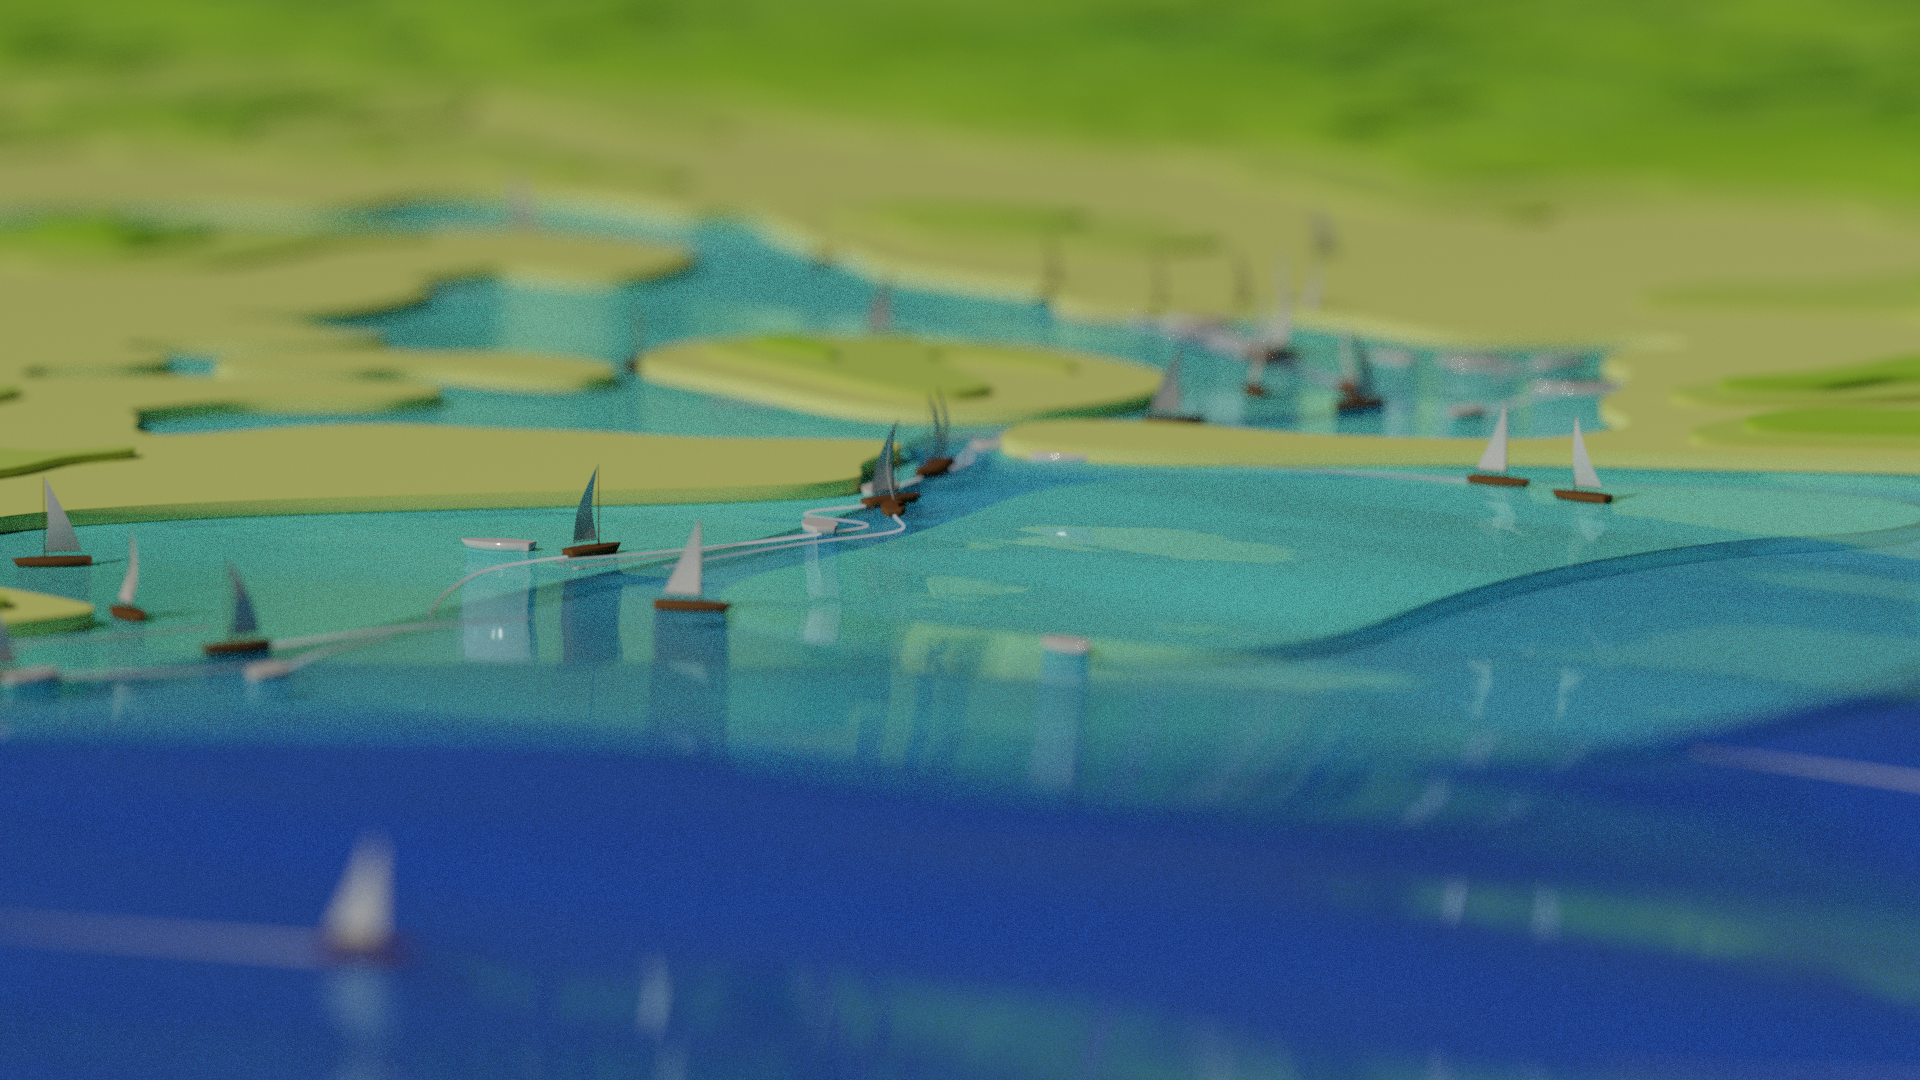
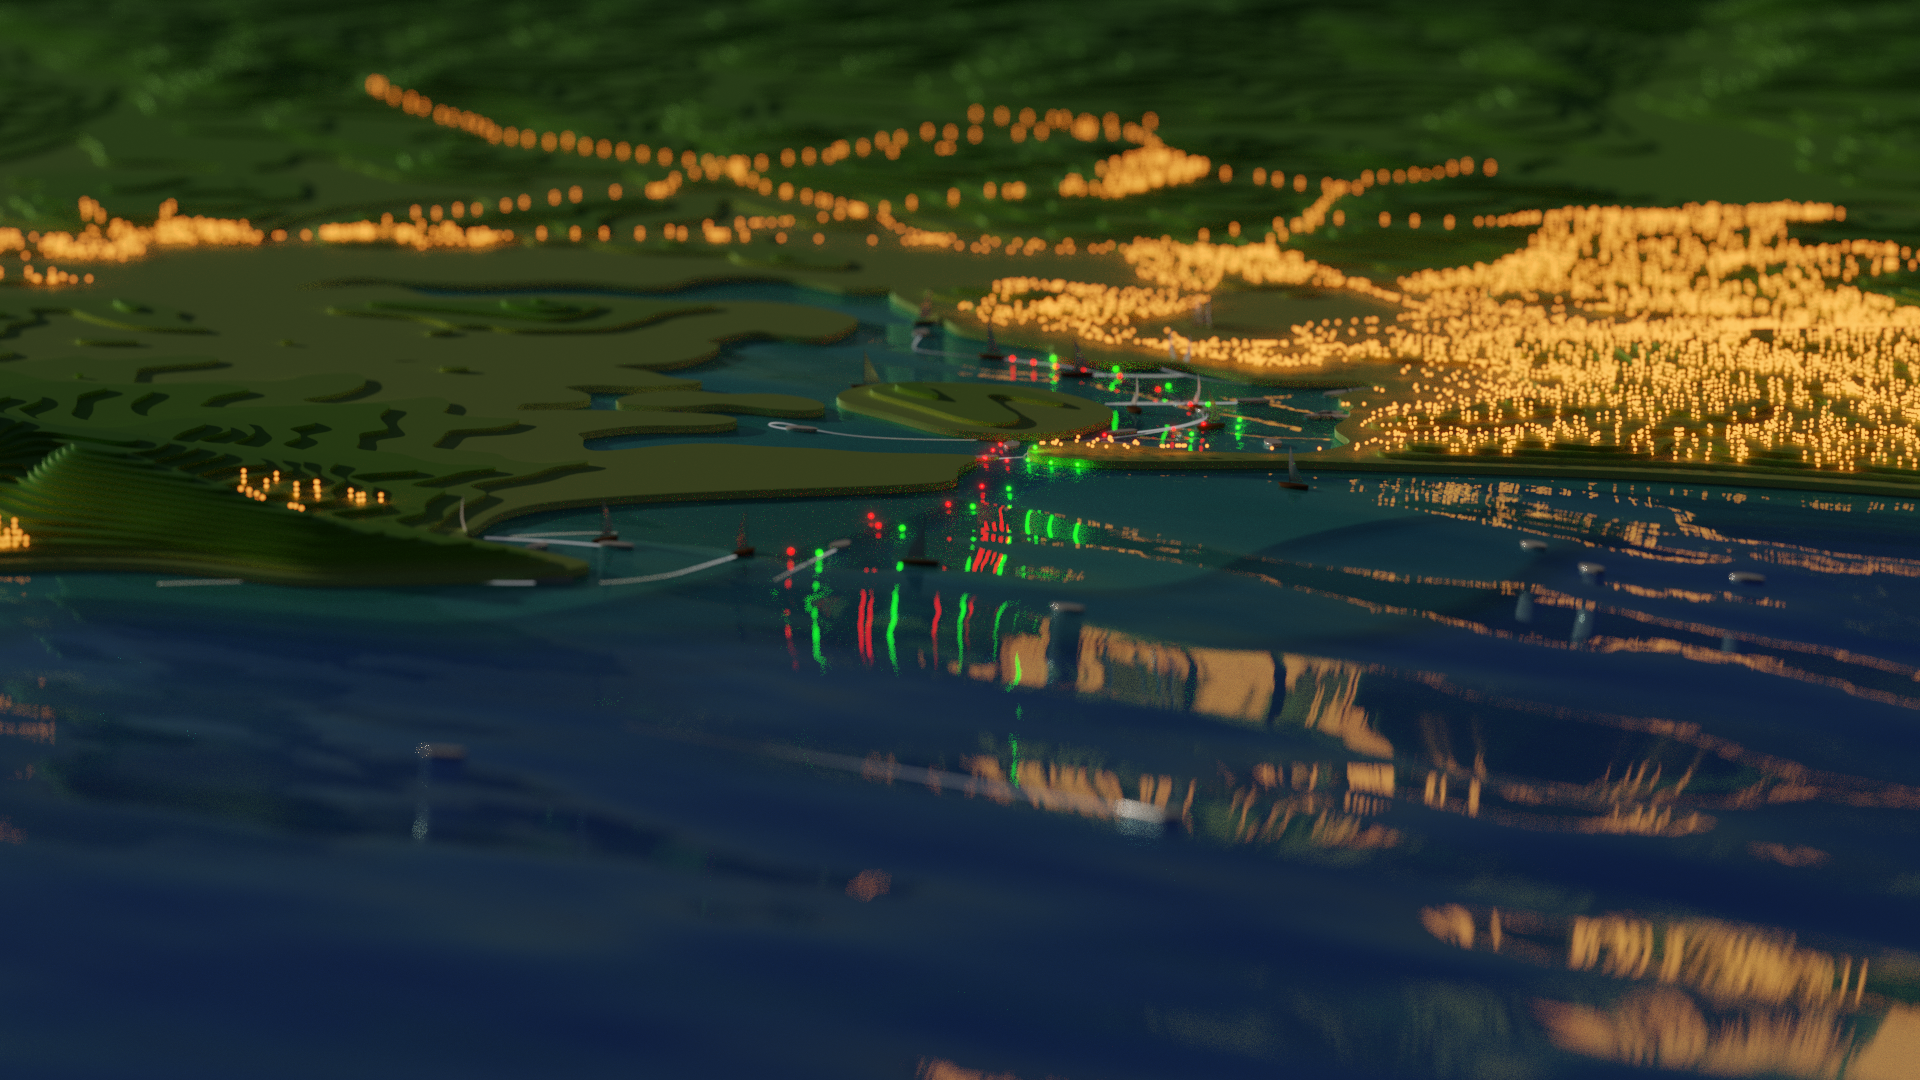
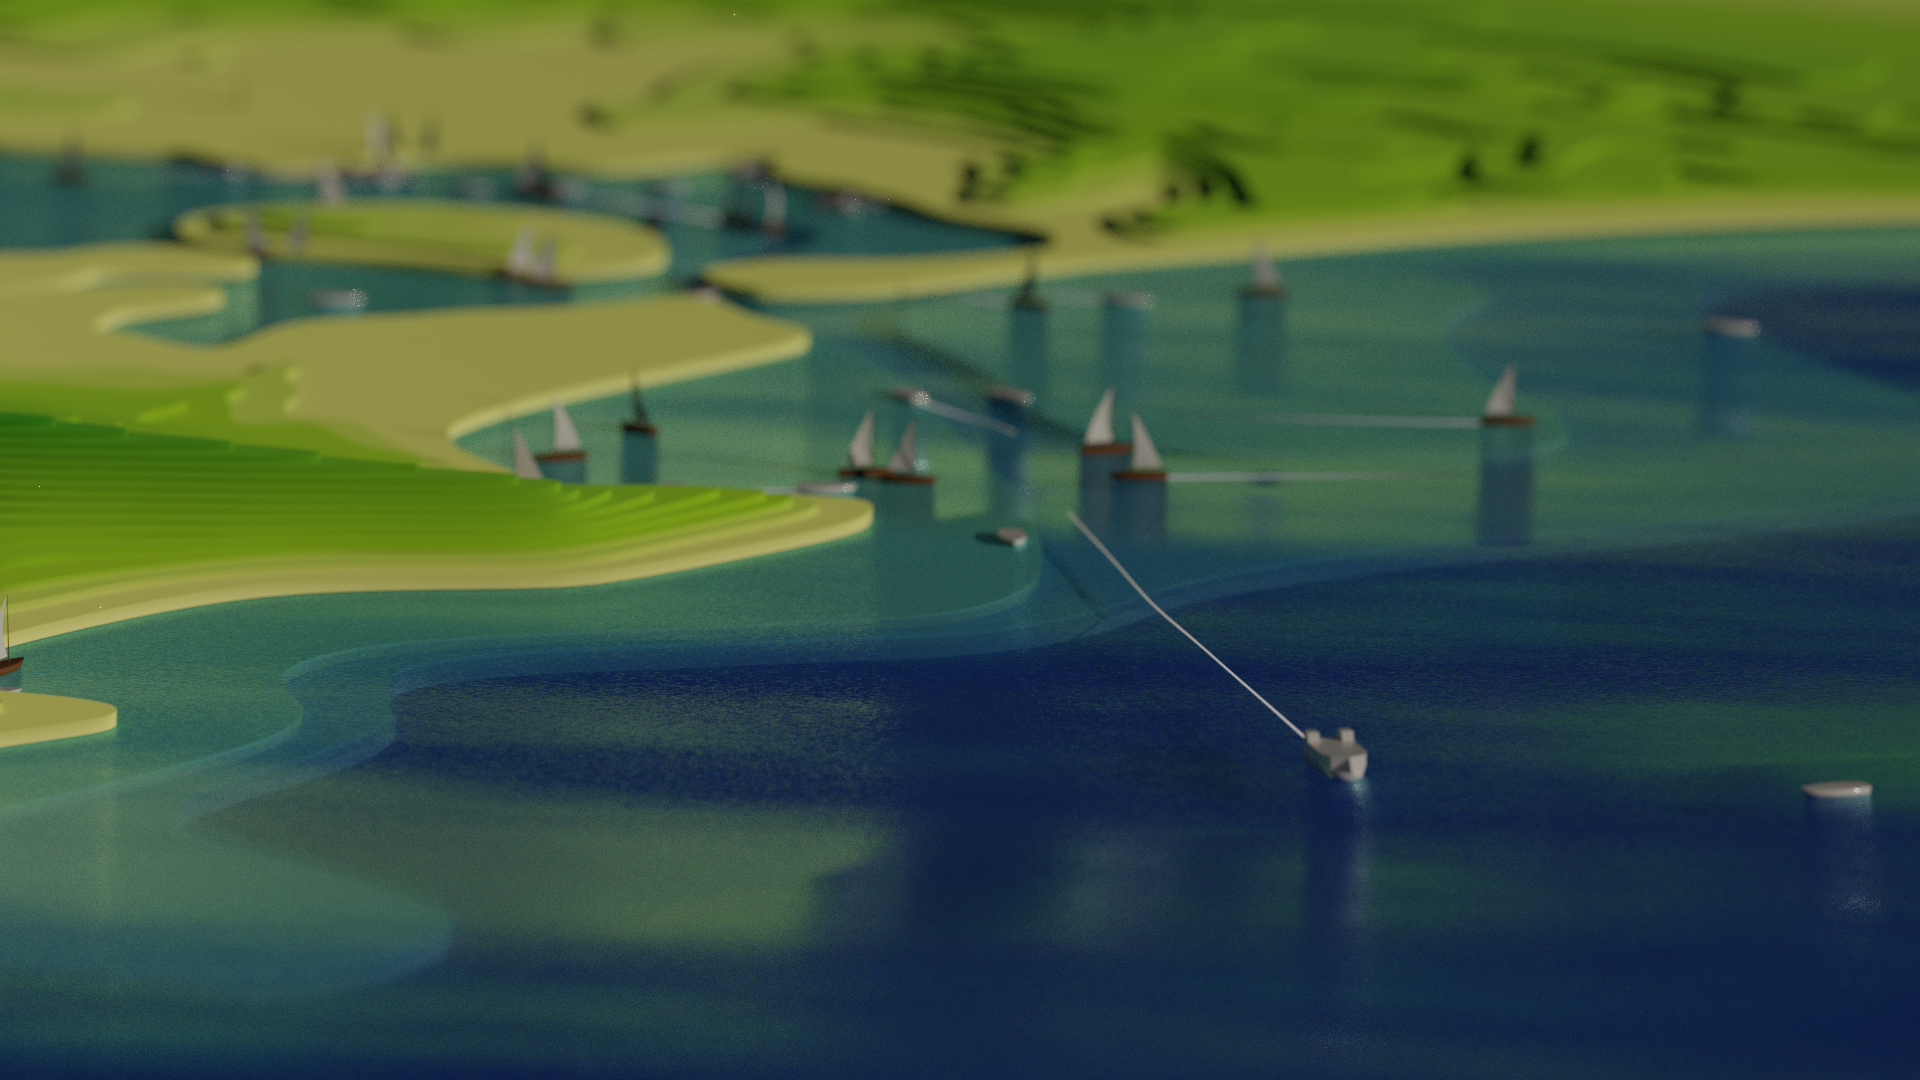
Poole Local Shipping Movements
Some projects take time, quite a lot of time. Since being inspired by the wider GIS community, I’ve been creating a series of geospatial animations in Blender based on real-world data. This post describes a concept that was almost a year in the making…
Behind the Scenes
Automatic identification system (AIS)
The automatic identification system (AIS) is an automatic tracking system that uses transceivers on ships to share and receive position information. The AIS tracking system was originally developed as a collision avoidance tool, allowing ships to ‘see’ each other along with useful information such as position, identity, speed and course. Many commercial vessels are required to fit AIS equipment but other vessels also use the technology.
At the simplest level, AIS operates between pairs of radio transceivers, one of which is always on a vessel. The other may be on a vessel, on-shore (terrestrial), or on a satellite. AIS transceivers automatically broadcast information, such as their position, speed, and navigational status, at regular intervals via a VHF transmitter built into the transceiver. We are lucky enough to live close enough to the water to receive these signals but to do so we need to create an AIS Receiver.
RaspberryPI
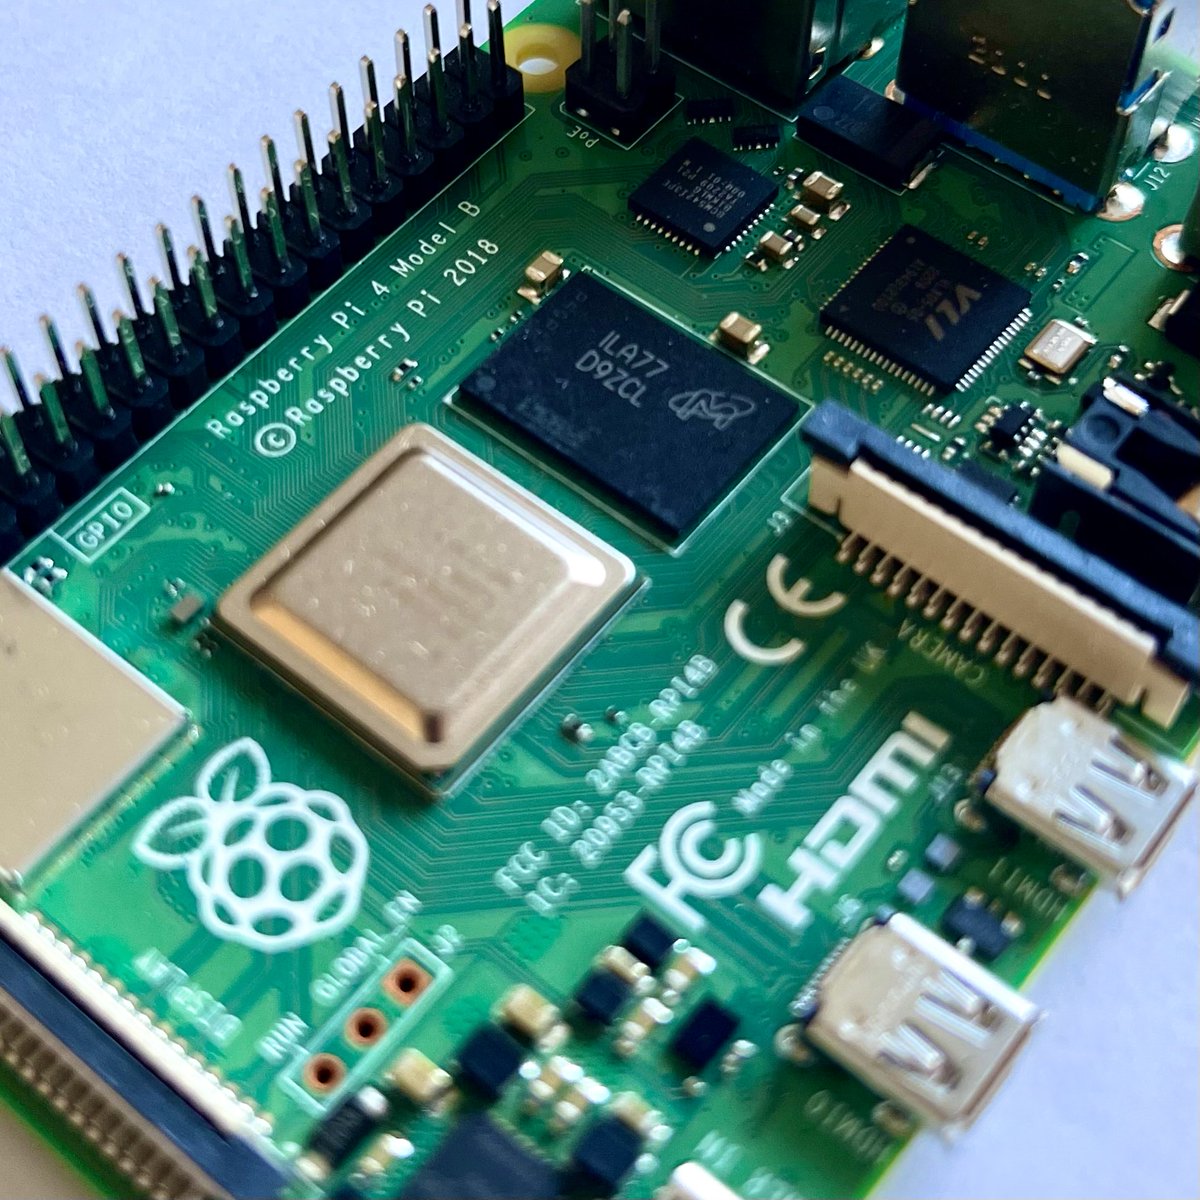
Raspberry Pi devices have become incredibly popular. Whether it was due to COVID lockdown or the subsequentl supply chain difficulties, it took me six months to find a Raspberry Pi 4 in the UK, eventually getting hold of one from The PiHut.
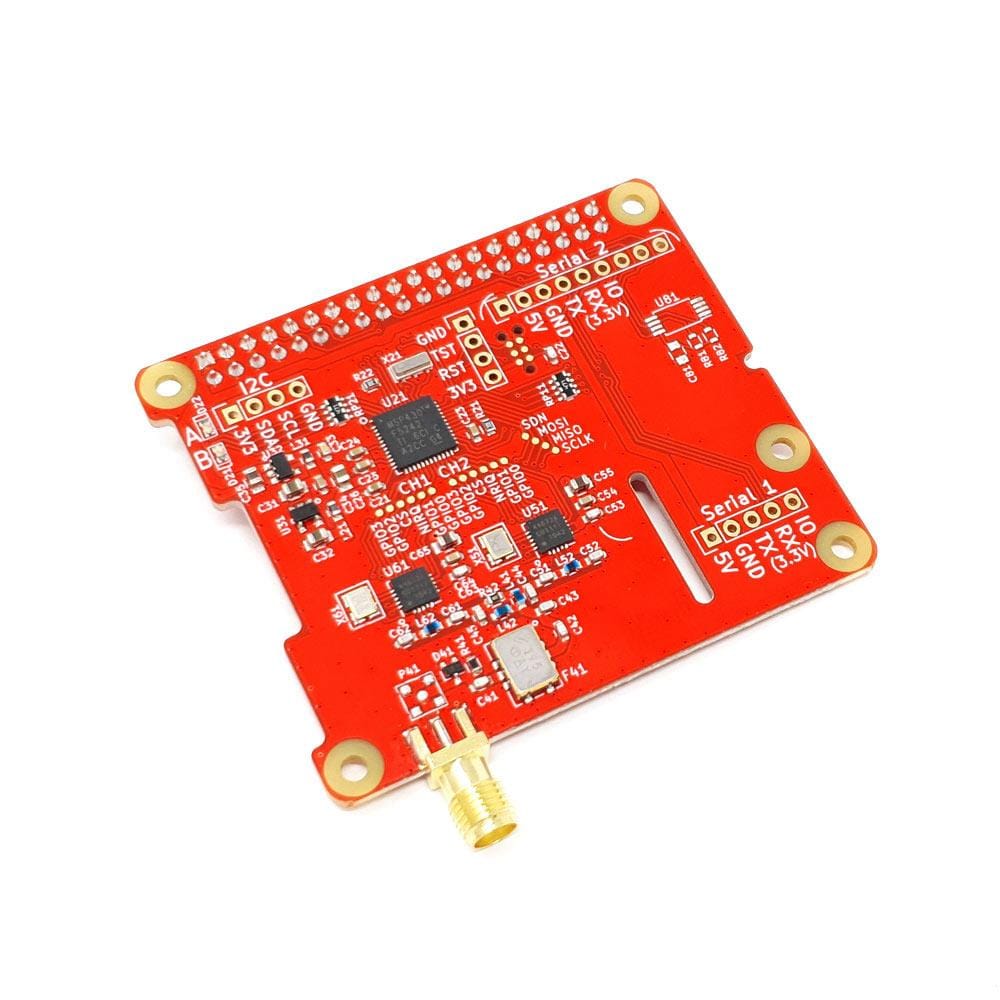
Fortunately, there is a ready-made AIS receiver for the Pi, called dAISy HAT. Note: there is also an ADB receive, but that’s for another day. The daisyHat provides a two-channel receiver, continuously receiving on AIS channels A (161.975 MHz) and B (162.025 MHz). We just need to add an aerial and should be good to go - I just used a simple stub aerial from Amazon along with an SMA to BNC connector.
AISHub
As AIS is radio based, signals are roughly limited to about 10-20 nautical miles, depending on the strength of the transmitted signal and the position of the aerial. These AIS signals can be supplemented with data from satellite receivers and there are a growing number of AIS tracking websites based on the data.
AISHub is one of these sites. The main goal of AISHub is to become an AIS data sharing centre. This means that if we share the AIS data from our PI dAISyHAT receiver, we are able to access the AISHub API and the global coverage it provides. While the data may not be as complete as commercial data sources, it will suit the needs of this project.
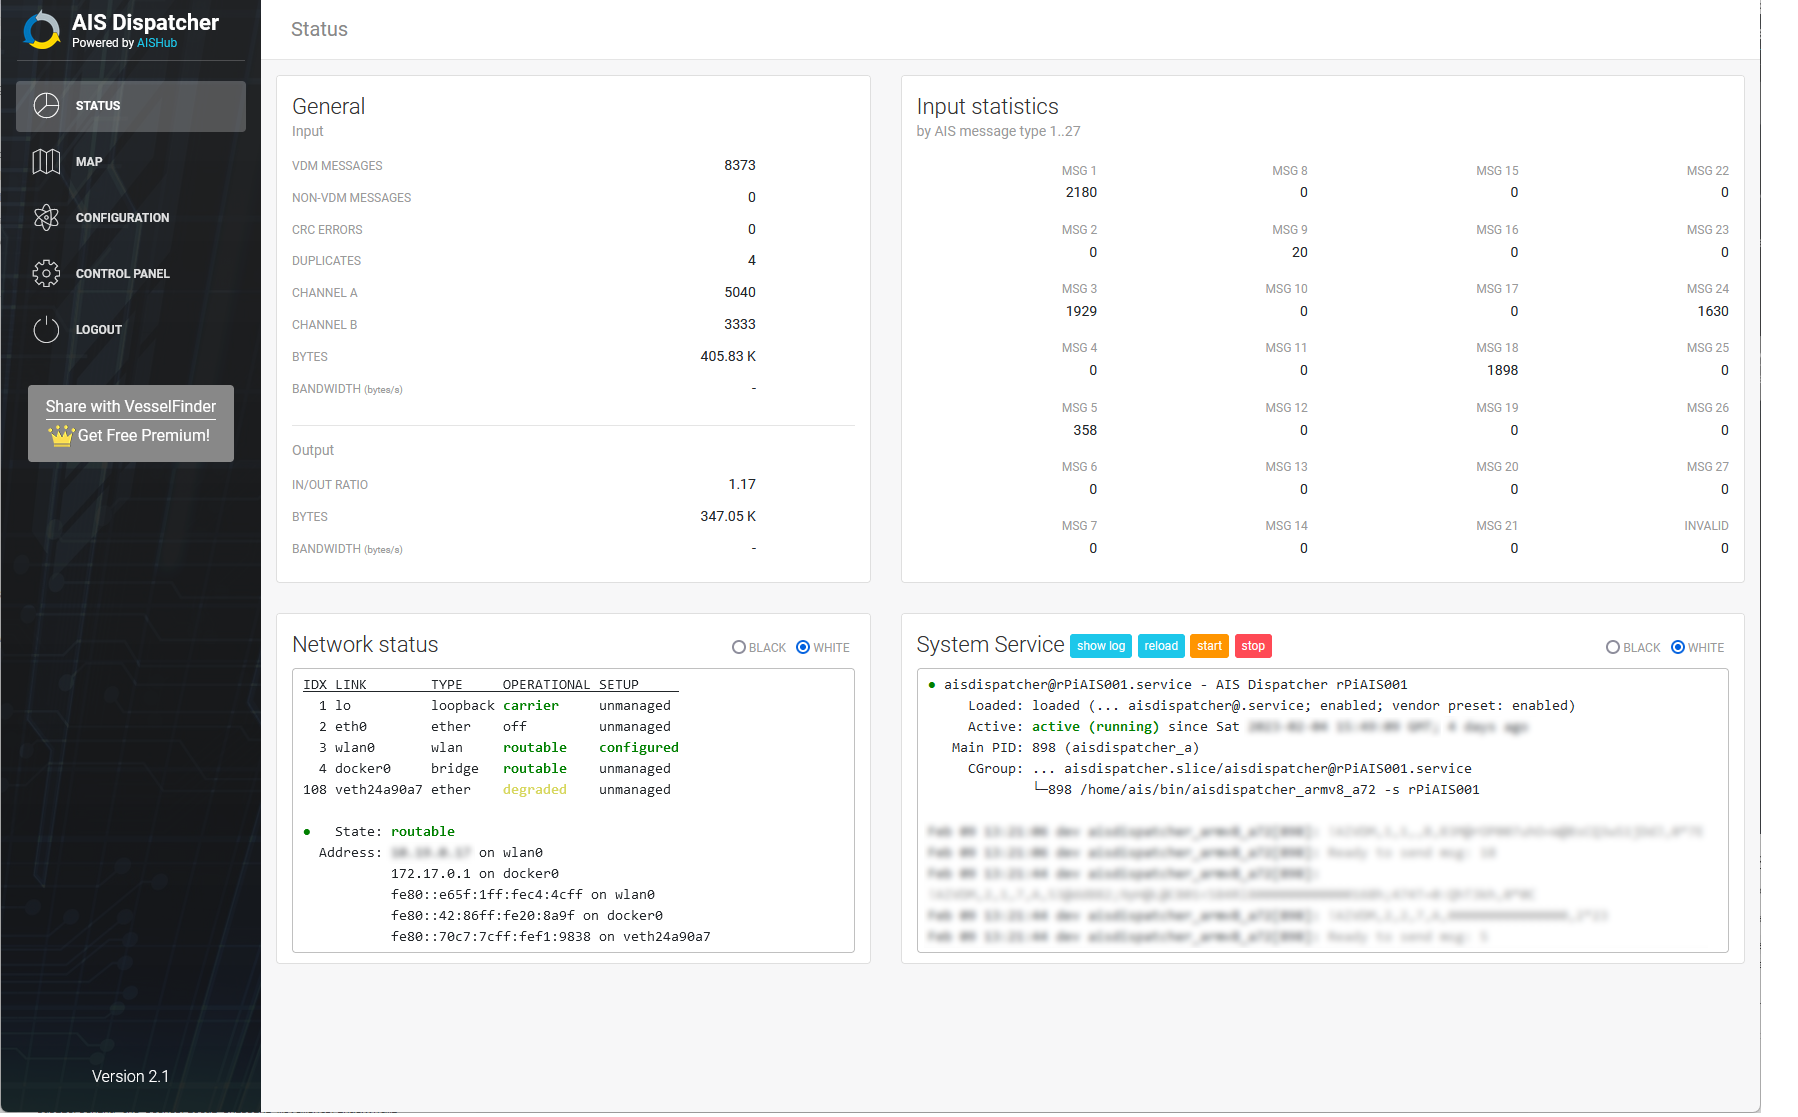
To share the our AIS data feed, we use the AIS Dispatcher software provided by AISHub. I installed Ubuntu on the PI and then followed the AIS Dispatcher installation instructions:
wget https://www.aishub.net/downloads/dispatcher/install_dispatcher
chmod 755 install_dispatcher
sudo ./install_dispatcher
Running AISHub on Raspberry PI ARM chips
While the installation completed successfully, I had to make a couple of changes to the configuration before the services would start. First, I needed to find the AIS startup scripts and change them to call the ARM binaries:
sudo find / -name "aiscontrol.service"
Update ExecStart in /home/ais/.config/systemd/user/aiscontrol.service to:
[Unit]
Description=AIS Control
After=network.target link-binary.service
Wants=link-binary.service

[Service]
WorkingDirectory=/home/ais
ExecStart=/home/ais/bin/aiscontrol_armv8_a72
Restart=always

[Install]
WantedBy=basic.target
Update ExecStart in /home/ais/.config/systemd/user/aisdispatcher@.service to:
[Unit]
Description=AIS Dispatcher %I
ConditionFileNotEmpty=/home/ais/etc/aisdispatcher/aisdispatcher_%I.opts
After=network.target link-binary.service
Wants=link-binary.service

[Service]
WorkingDirectory=/home/ais
EnvironmentFile=/home/ais/etc/aisdispatcher/aisdispatcher_%I.opts
ExecStart=/home/ais/bin/aisdispatcher_armv8_a72 -s %I
Restart=always
ExecReload=/bin/kill -HUP $MAINPID
SyslogLevelPrefix=true

[Install]
WantedBy=basic.target
Configuring the serial port
Once AIS Dispatcher was up and running, I had to also make a couple of changes to the serial port configuration:
wget https://github.com/itemir/rpi_boat_utils/raw/master/uart_control/uart_control
chmod +x ./uart_control
sudo ./uart_control gpio
sudo reboot now
Finally, change /boot/firmware/cmdline.txt to remove:
console=serial0,115200
Configuring AIS Dispatcher
We should now be able to access the AIS Dispatcher web interface and configure to use /dev/ttyS0.
Accessing the AIS Hub API
Once AIS Dispatcher, we can contact the team for details on where to upload our data. I received an email back from the team the day after I submitted the form and once my data was flowing, I was able to access the AIS API.
The AIS API is a simple web service enabling us to submit a set of parameters and the response contains recent AIS data. The AISHub documentation is great and the primary webservice url is
https://data.aishub.net/ws.php?username=A&format=B&output=C&compress=D&latmin=E&latmax=F&lonmin=G&lonmax=H&mmsi=I&imo=J&interval=KThe parameter definitions are as follows:
| Parameter | Default | Description |
|---|---|---|
| A | - | your AISHub username. You will receive it after joining AISHub. |
| B | 0 | format of data values (0 – AIS encoding , 1 – Human readable format) |
| C | xml | output format (xml, json, csv) |
| D | 0 | compression (0 – no compression, 1 – ZIP, 2 – GZIP, 3 – BZIP2) |
| E | -90 | South (minimum) latitude |
| F | +90 | North (maximum) latitude |
| G | -180 | West (minimum) longitude |
| H | +180 | East (maximum) longitude |
| I | - | MMSI number or list of numbers (webservice returns data for the requested vessels only) |
| J | - | IMO number or list of numbers (webservice returns data for the requested vessels only) |
| K | - | The maximum age of the returned positions (in minutes) |
Saving AIS Data locally
I created a small NodeJS script to call the AISHub API periodically, download data for the Poole Bay region, and save it to a MySQL database.
Preparing data for Blender - real world data is hard
We have a set of timestamped co-ordinate positions for each vessel. All we need to do is load these into Blender… Not quite.
- AIS signals come and go - leading to vessels appearing, disappearing or remaining static for long periods of time. Largely, this seemed to occur as vessels moved out of range from one AIS receiver and then, later moved into to range from another receiver. For the localised animation here, I think I took the easy option to hide the vessels from the render. Theoretically, it would be possible to interpolate but ships cannot take shortcuts across land….
- Some vessels publish bearings, others do not. What’s more if an object is rotating about a fixed point for a time period, Blender takes the latest bearing when the object starts to follow a path - this led to some vessels pointing in strange directions when they were moving!
- The AIS data uses latitude and longitude. We need to convert to x,y. It may be obvious from the name, but one of the beauties of open source software is being able to read the source. The BlenderGIS plugin handles geo-referenced scenes (and I use this plugin to load the base polygons for the landscape). Thanks to open source, We can reuse:
#import BlenderGIS modules depends on how the package is named
#if the addon is installed through github zip archive
#then the name contains an illegal hyphen
#bellow an hacky workaround
import sys
sys.modules['BlenderGIS'] = __import__('BlenderGIS-225')

from BlenderGIS.geoscene import GeoScene

scn = bpy.context.scene
geoscn = GeoScene(scn)

print("Loaded BlenderGIS")
dx, dy = geoscn.getOriginPrj()
print("dx, dy:" + str(dx) + "," + str(dy))

def getProjection():
    projection = None
    lat = float(0)
    lon = float(0)
    print("Getting projection")
    from util.transverse_mercator import TransverseMercator
    # fall back to the Transverse Mercator
    projection = TransverseMercator(lat=lat, lon=lon)
    return projection

def changeProjection(rows):
	print("in changeProjection()")
	print(f"dx, dy: {dx},{dy}")
	if (dx == None) or (dy == None):
		print("Has a georeferenced object been imported")
	data = []
	for r in rows:
		x = float(r['easting']) - dx
		y = float(r['northing']) - dy
		z = 0
		newData = [x, y, z]
		data.append(newData)
	return data
Creating Blender curves from points
Creating a curve (or path) in Blender programmatical is probably one of my most commonly used functions. This function has been used in at least half of my animations.
The code below creates either a ‘NURBS’ or a ‘BEZIER’ curve in Blender. The NURBS curve will automaticall smooth whereas with the ‘BEZIER’ curve, the handles also need to be specifed. In this function, the handles are set to the same value as the point, which essentially means no smoothing.
def addCurve(points, objectName):
	curveType = 'NURBS'
	coords_list = []
	for p in points:
		coords_list.append([p[0], p[1], p[2]])

	crv = bpy.data.curves.new('crv', 'CURVE')
	crv.dimensions = '3D'
	if (curveType == 'BEZIER'):
		# make a new spline in that curve
		spline = crv.splines.new(type='BEZIER')
		# a spline point for each point
		spline.bezier_points.add(len(coords_list)-1) # theres already one point by default
		# assign the point coordinates to the spline points
		for p, new_co in zip(spline.bezier_points, coords_list):
			p.co = (new_co)
			p.handle_left = p.handle_right = p.co
	elif (curveType == 'NURBS'):
		spline = crv.splines.new(type='NURBS')
		# a spline point for each point
		spline.points.add(len(coords_list)-1) # theres already one point by default
		# assign the point coordinates to the spline points
		for p, new_co in zip(spline.points, coords_list):
			p.co = (new_co + [1.0])
	# make a new object with the curve
	obj = bpy.data.objects.new(objectName, crv)
	bpy.context.collection.objects.link(obj)
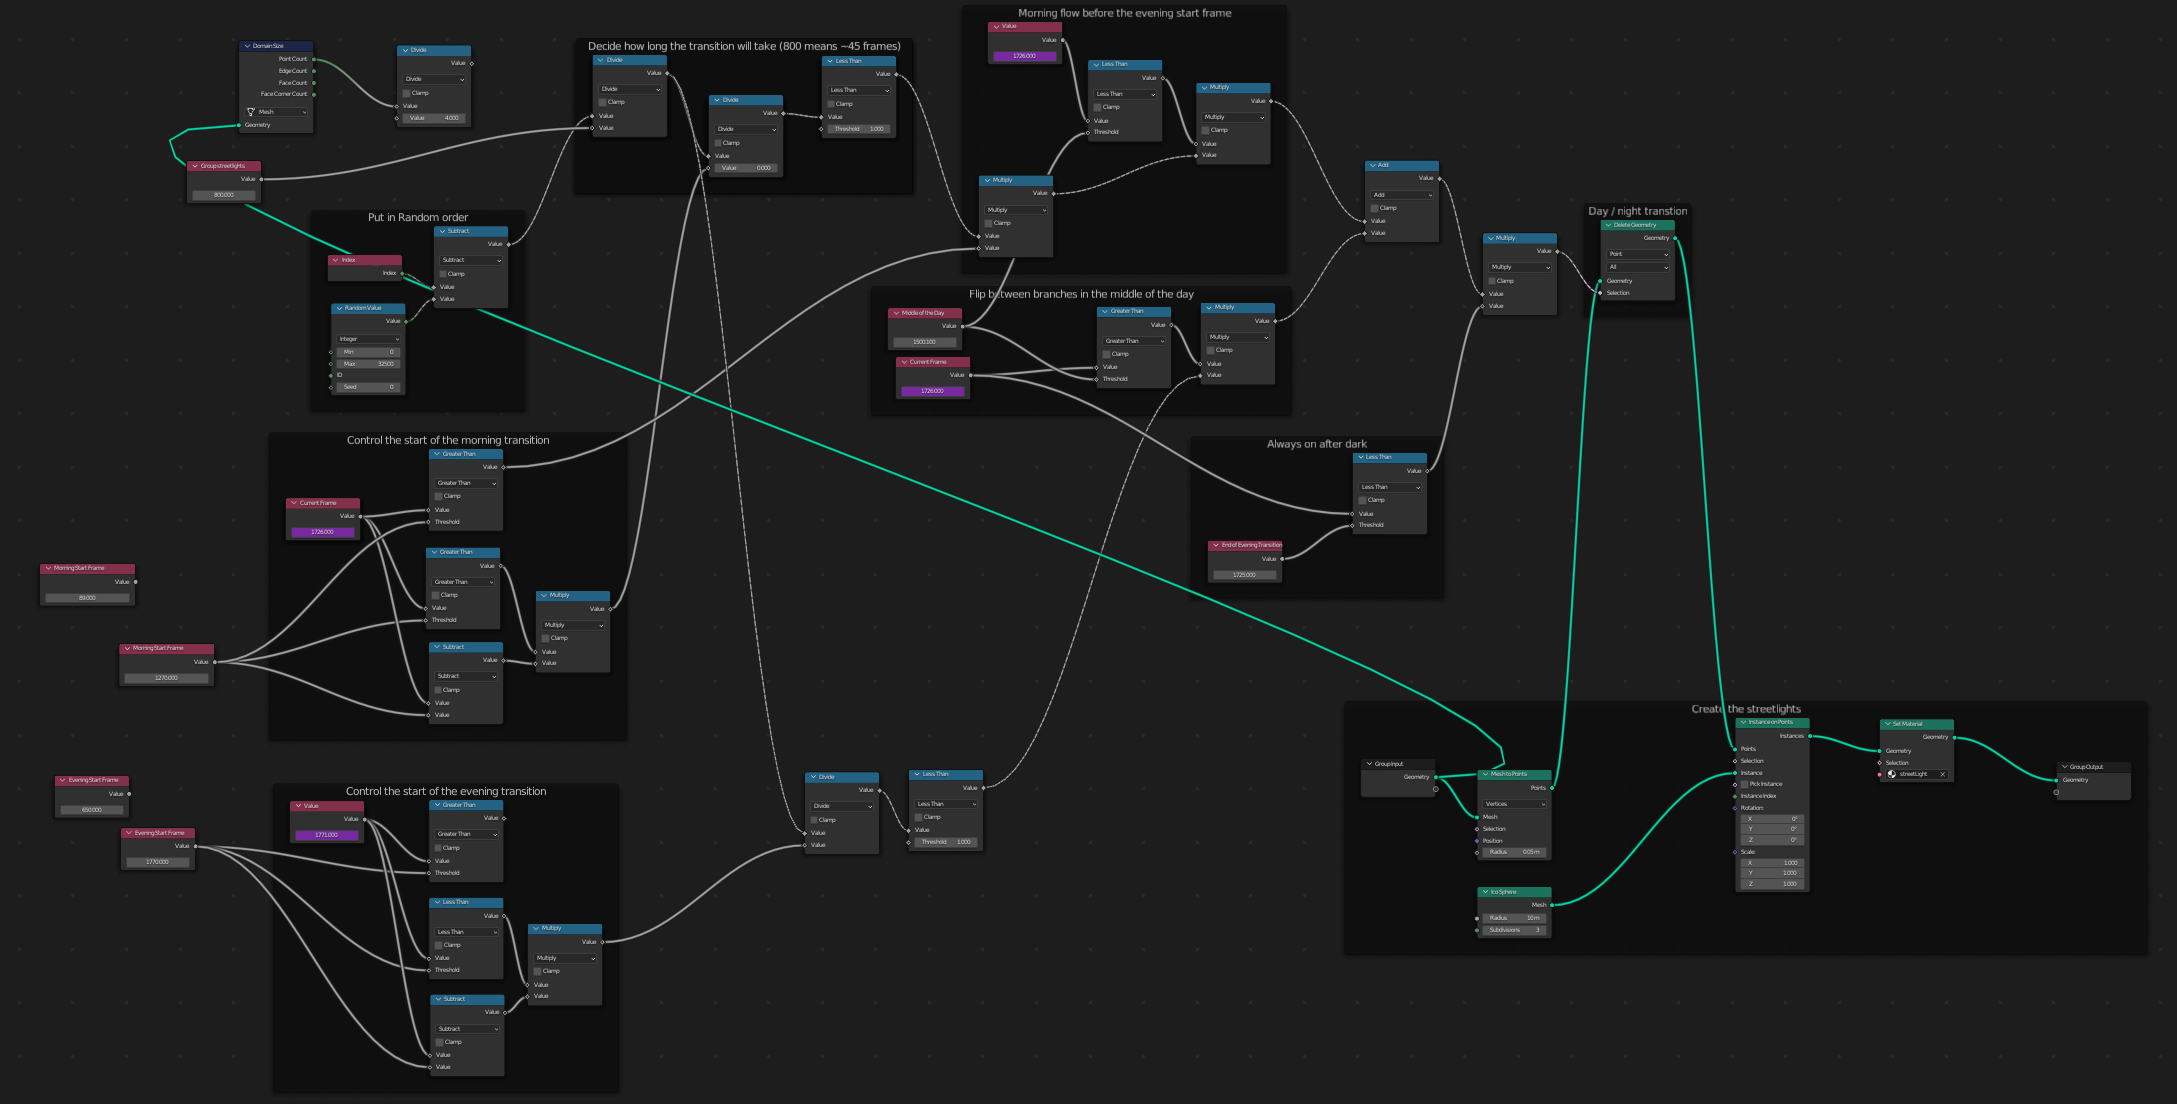
Bonus Extra: Animating Streetlights
There are quite a lot of streetlights in the model (about 35,000). The position of each light was derived from the OSM road network in QGIS using “Points on lines”. Blender doesn’t seem to handle animating a very large number of objects particularly well, but I was able to create a single point mesh object and use geometry nodes (“Delete geometry”) with a randomised input node based on #framenumber to control the morning / evening lighting changes. The approach worked well for a single day, but it would need more work to scale for multiple days.
Final Result
There are a fair few more details in the final animation:
- 3D Takanna polygons for the land based on OS Terrain data
- Takanna polygons representing seabed / channel depth handcoded from the Poole Harbour navigation map
- Illuminated bouys, again based the Poole Harbour navigation map (I didn’t add them all)
- Animated sea texture
- Different ship objects based on the AIS vessel type
- Ship wakes. I wanted to more realistically represent with angles but ran out of time to figure out how
- animated streetlights
- soundtrack
- …
Now that I have finally written this ‘Behind the Scenes’ post, I am starting to understand why this 30 second animation was almost a year in the making.
Barefleur By Night
Barfleur is one of the largest ships to regularly enter Poole harbour, sailing regularly to Cherbourg. For #30DayMapChallenge Day 28 - 3D, I added yet more details… Smoke from the funnels and passenger lights. The smoke worked well for single frames. I spent far too long playing with geometry nodes to animate the smoke but struggled to get a realistic result. One for another day.